Projects & Experience
There's nothing I'm not capable of learning and understanding.
High-Power Rocket Bootcamp

My latest and proudest project. I started the bootcamp in August 2025. It is free for every student. Each student builds, paints, and launches their own high-power rocket under my supervision as a Tripoli Rocketry Association and National Association of Rocketry certified mentor. The rockets fly up to 5,000 feet (next phase: electronic dual deployment). Along the way they learn aerodynamics, propulsion, recovery systems, and how FAA airspace coordination works. I am the Flyer of Record: I am responsible for every rocket being built correctly and flying safely.
So far: 220+ participants trained, 336 rockets built, 170+ launched, about $155,000 in approved funding (MEPI, Cummins, Lilly, Purdue University), and a public goal of 1,000 rockets. The goal behind the goal is to make Indianapolis the rocket capital of the world. At LDRS 44, the world's largest high-power rocketry launch, I flew 34 rockets, the most of any flyer.
Project Manager, Capital Projects

I evaluate, manage, and execute requirements for large capital projects. I am currently leading a $150M+ capital capacity expansion, directing design, construction and C&Q for FDA-regulated manufacturing facilities that produce medicine for patients.
B.S. Mechanical Engineering, Aerospace Minor

Graduate of the MSU Honors College with a B.S. in Mechanical Engineering and an Aerospace minor.
Open my degree (PDF) ↗Download PDF ↧Read the text
Michigan State University. Upon the nomination of the Faculty of the College of Engineering has conferred upon Tanaka Craig Chonyera the Degree of Bachelor of Science with a Major in Mechanical Engineering, The Honors College. Given under the Seal of the University at East Lansing in the State of Michigan on this twenty-sixth day of April in the year Two Thousand and Twenty-four. Signed by the Chairperson of the Board of Trustees and the President of the University.
Page 2, Certified Electronic Diploma (CeDiploma). To validate this credential: the CeDiD is located in the upper left-hand corner of the credential (page 1). The CeDiD is a unique identifier and is required for validation. Enter the CeDiD at the institution's official validation website, https://reg.msu.edu/StuForms/StuInfo/CediplomaValidate.aspx. Validation includes complete degree information that is time and date stamped by the issuing authority. To verify the digital signature: this credential is certified by CeCredential Trust and should read as such. The ribbon signifies that both pages of this document have not been modified since issued. Do not trust this document if any other symbol is displayed.
Attestation of the Registrar. This Certified Electronic Diploma (CeDiploma) acknowledged herein represents satisfactory completion or attainment of education as authorized by the institution identified. This CeDiploma (credential) has legal standing, is non-repudiating, and can be validated through the Institution's website to provide absolute confidence in the credential's authenticity. Questions should be directed to [email protected].
Solar car body design (senior capstone, team lead)
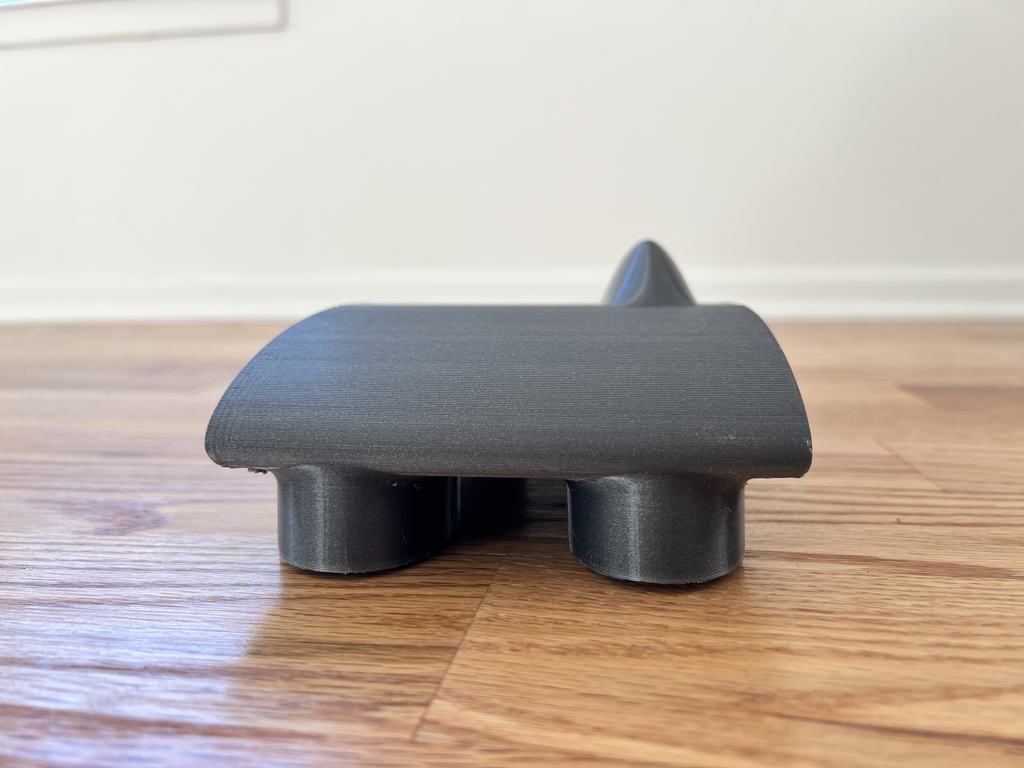
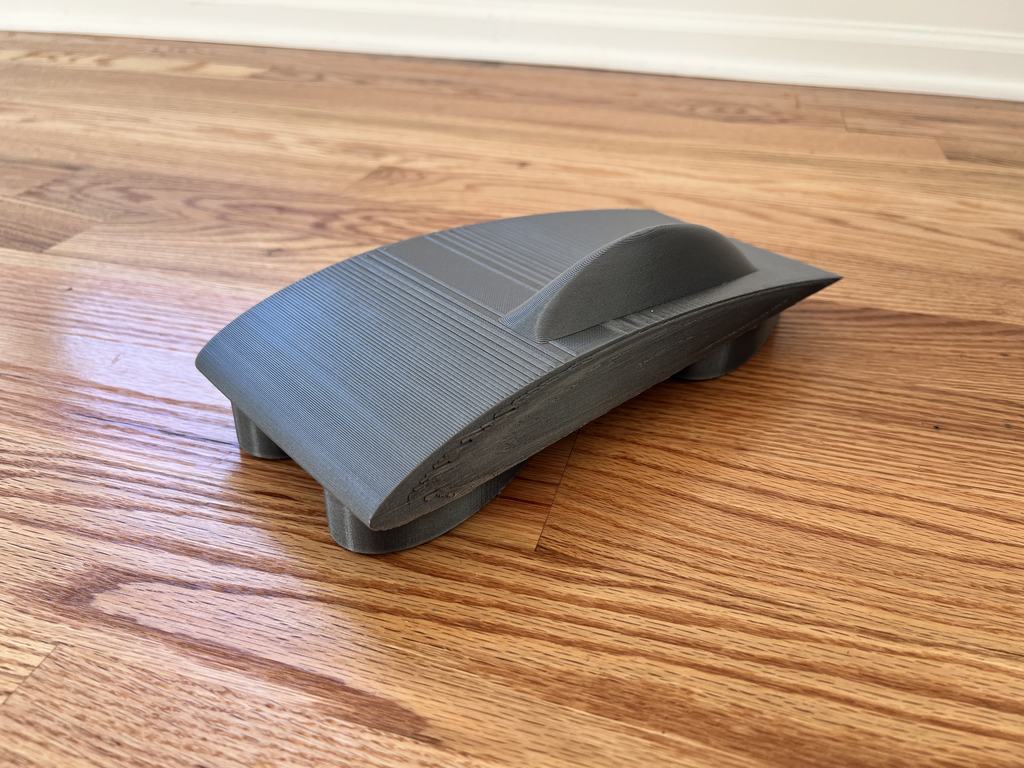
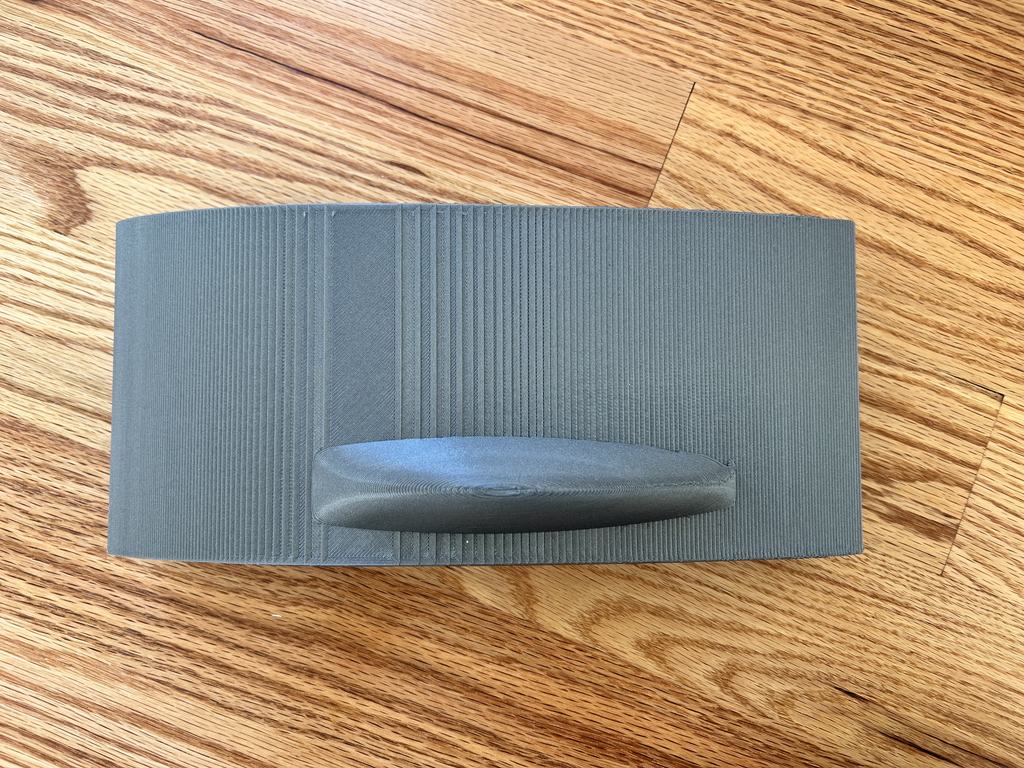
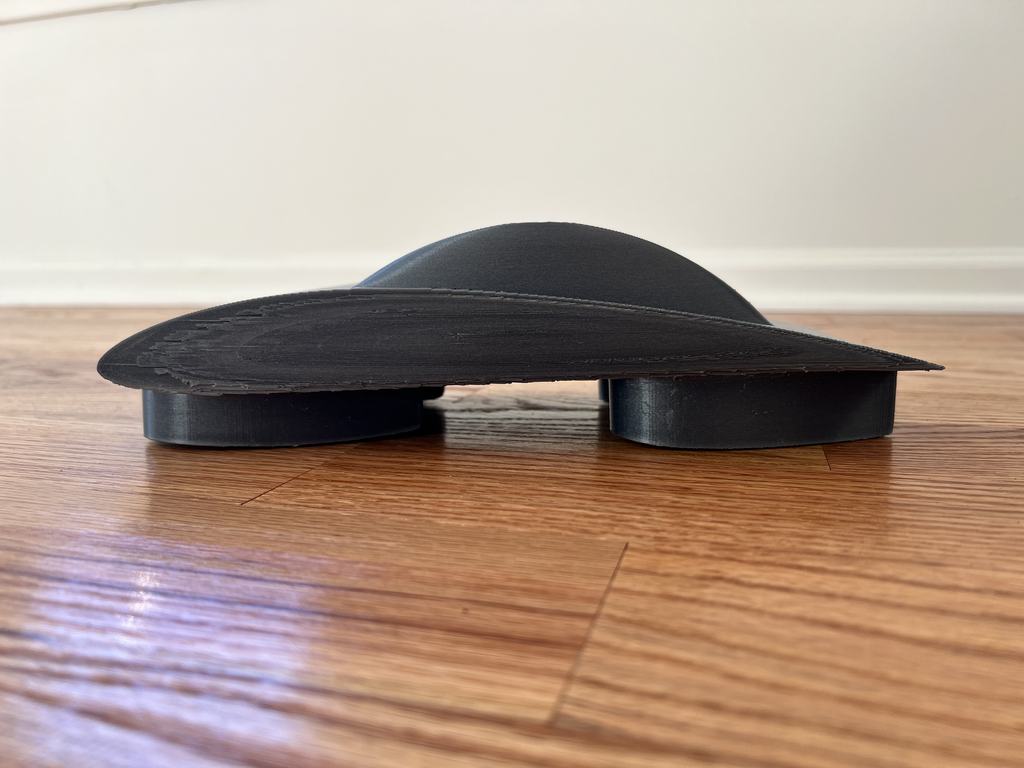
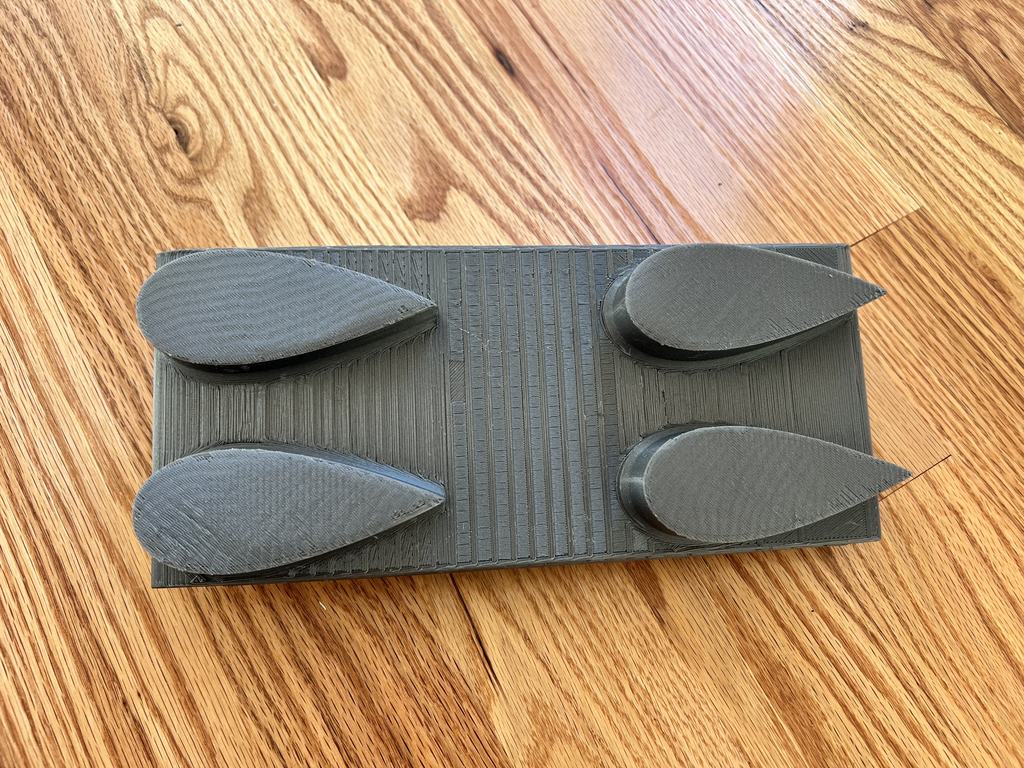
I led my senior capstone team designing a new body for MSU's Solar Racing team. We utilized fundamental principles of aerodynamics, boundary layer theory, and other fluid mechanics principles to produce a design that significantly improved aerodynamic performance through drag reduction. 4.0 in the class! Here's the final report:
Open the final report (PDF) ↗Download PDF ↧Read the text
ME 481, DG23 Senior Capstone Design. Solar Car Body Design. Final Report.
Tanaka Chonyera, Sammy Dickow, Angelo Bartolome, Isaiah DeVougas, Tyra Treadway. Industrial Advisor: Ethan Stull. Academic Advisor: Dr. Ahmed Naguib.
Contents: Introduction to the Problem; Identification of Needs; Problem Constraints; Solution Research and Benchmarking; Problem and Solution Impact on Public Welfare, the Environment and Sustainability; Concise Problem Definition and Deliverables; Initial Plan and Contingency Plan; Presentation and Evaluation of Alternatives; Analysis and Modeling of the Selected Alternative; Concept Design Recommendation and Justification; Conclusions and Recommendations; Appendices A to C. Equations, figures and the airfoil data tables are in the PDF.
Introduction to the Problem. Michigan State University’s Solar Racing Team (MSU SRT) is composed of students who race full-sized solar cars, which are designed and manufactured by the team, that are powered electrically. Our capstone team is tasked with designing a body for the solar car that is aerodynamic, lightweight, and easy to manufacture. We are to compare and advise as to the manufacturability versus theoretical performance of carbon fiber aeroshells, monocoque body/chassis, and segmented flat paneling for future car build cycles. The new designs are to be novel or modeled after the 3 previous shells. Body design plays a critical role in the vehicle's overall performance as drag and other aerodynamic effects directly impact top speed, acceleration, and maneuverability of the car by improving or worsening these factors.
Identification of Needs. The team's primary focus should be on producing a clear, feasible body design that enhances the aerodynamic performance of the solar car. This enhancement must directly address crucial factors such as drag reduction, airflow optimization, and overall vehicle efficiency. However, it is imperative to balance this focus with considerations for manufacturability. The chosen body designs should be easy to manufacture, considering factors such as material availability, fabrication techniques, and production costs. Priority must be given to reducing manufacturing time and costs without compromising the structural integrity or aerodynamic properties of the vehicle. Exploring cost-effective solutions and streamlined manufacturing processes is essential to achieve this objective. By effectively addressing these key needs, the capstone team can guide the design process towards developing a solar car body that not only improves aerodynamic performance but also ensures manufacturability and cost-effectiveness.
Problem Constraints. Our design is constrained by the rules and regulations for the 2024 Formula Sun Grand Prix and American Solar Challenge. According to the American Solar Car Challenge 2024 Revision C, the solar car must adhere to specific dimensions: a maximum length of 5.0 m, height of 1.6 m, and width of 2.2 m when in motion, with allowances for wheel extensions during turns. Ground clearance of at least 100 mm is required for all parts except tires, wheels, and hubs. Occupants' eyes must be at least 700 mm above the ground, and the driver must maintain visibility of points 8 m in front, 6.4 m above, and 100° to either side of the car. Additionally, the driver must identify 75 mm high letters 3 m ahead and 50 mm high letters 3 m to the side, with minimal obstruction to forward vision from the roll cage. We will also need to design around the existing chassis and ensure the proposed designs are realistic regarding manufacturability and cost.
Solution Research and Benchmarking. Our research and benchmarking process involved gaining insight from our industrial advisor, analyzing designs and performance of other solar car teams, and utilizing key resources like “Fluid-Dynamic Drag” by Dr. Sighard F. Hoerner and “A Solar Car Primer” by Erica Forsta Thatcher. We used drag coefficient plots and dimensional ratios for Hoerner’s book to optimize the cockpit design, resulting in a 50% reduction in drag coefficient. For the fairing designs, we compared various symmetric NACA airfoil shapes using the equations from Thatcher’s book and selected a design that significantly reduced the drag coefficient. The main body design was evaluated using Xfoil software to obtain lift and drag coefficients for several NACA airfoil profiles at the vehicles operating Reynolds number, with special consideration for factors like driver space and manufacturing ease. By utilizing these insight and through careful analysis, we developed a novel solar car body design that reduces drag and weight, improving the vehicles overall performance. Problem and Solution Impact on Public Welfare, the Environment and Sustainability This product can potentially draw more attention to solar power and other clean energy solutions. The more successful the team is the more likely people are to investigate alternative energy solutions. Racing is a great frontier to promote renewable energy and vehicle electrification for the following reasons: 1. Public Interest and High Visibility Racing events typically attract large audiences and media attention which provides a unique opportunity to showcase the capabilities of electric vehicles and renewable energy. 2. Performance Demonstration & Excitement Racing allows manufacturers to demonstrate the potential of electric vehicles and renewable energy in a competitive space. There are pervasive notions about electric vehicles, they have no soul, or they are not as loud and exciting as internal combustion engines but events like the American Solar Challenge or Formula E can turn the tide. 3. Innovation Racing has historically been a vector for inspiring technological breakthroughs that eventually find their way into mainstream consumer vehicles. This is analogous to the space race which led to the development and mainstream adoption of technology now used for Bluetooth, athletic shoe cushioning and firefighting equipment. Competition + constraints = creative innovation. In a world where everyone is constantly looking for new ways to reduce emissions or their carbon footprint, solar cars can serve as a powerful education tool. Only 3.8% of electricity in the US is solar powered, there is a significant potential for growth.
Concise Problem Definition and Deliverables. We must produce clear, feasible body design that improves the aerodynamic performance of the car while maintaining relative ease of manufacturing, in our case the relative ease of 3D printing. Provide clear data that shows the benefits of the innovative design. Follow the rules given by the Formula Sun Grand Prix and the American Solar Challenge.
Initial Plan and Contingency Plan. Our initial plan was to first obtain data on the current solar body car design of the MSU solar race team. This data includes the shape of the car obtained through a CAD file given to us by the body lead in the solar race team and dimensions of the original car. This was accomplished by meeting with our industrial advisor who is a current engineering lead in the solar race team. More information was obtained by visiting their workshop and taking more measurements on the dimensions of the vehicle. Once we had a precise understanding of how the current car looks, we now went into what we can do to improve their current design. To do this, we looked at three integral parts of the car which were the shape of the cockpit, the body, and the pontoons which encased the wheels at the bottom of the car. The main goal of our team was to make the current car more aerodynamic, so we decided to accomplish this through designing various shapes of airfoils and applying them into our new design. Reasons why we wanted to go with the airfoil shaped will be explained further in the report, but the airfoil is the most aerodynamic shape which eliminates pressure drag in the trailing edge which is a significant factor in slowing the car down. Once the design is finalized and modeled in NX Siemens, both the original design and our new improved design will then be 3D printed and will be tested in a wind tunnel at the engineering facility at Western Michigan University. Through this, a platform would have to be made from scratch to attach our 3D printed model to the platform to hold it in place. A pressure sensor would then be placed at the trailing edge of the platform which gives us the drag that its experiencing through the wind tunnel. The wind tunnel would first run with just the platform itself and the drag for that would be noted. Then the wind tunnel would run again, but this time the car would be attached to the platform in the wind tunnel and the drag recorded. We would then subtract the drag of the platform from the drag of the car with the platform and the result would be the drag that we would use. With the wind tunnel testing, time is a big issue. Since the wind tunnel is around two hours away from East Lansing, travel time must be accounted for. Another time cost that comes with wind tunnel testing is the 3D printing. To produce results such as drag that can be comparable to a true size model, a quarter scale model will have to be printed for both the original and improved design and both models will have to have wind velocities of around 100 miles per hour in the wind tunnel to produce usable data. The issue that comes with this is that for a one quarter scale design, the design would take around two weeks to print so if wanted both designs printed and tested, a month will need to be accounted for. After deciding that the wind tunnel method presents too many time constraints, a contingency plan was then drafted. The contingency plan was to do hand calculations of our improved design to find the drag. These hand calculations are the analytical approach to explaining how and why the cockpit and the fairings were designed. Due to the limited time that we have for the project, the contingency plan is what we decided as the best approach for the rest of the project.
Cockpit design. The cockpit design was the initial design change proposed. It was theorized that making the cockpit longer and lowering the height would reduce drag. The book Fluid-Dynamic Drag by Dr. Sighard F. Hoerner confirms this. Using a series of ratios and drag coefficient plots, optimized dimensions for the cockpit were obtained. The first thing to note is the constraints. The first was accommodating a driver. The team informed us that the maximum height of the driver will be around 5 foot 7 inches. The Cynisca design had a cockpit height of 16.25 inches. Note that the cockpit height is defined as the maximum height above the main body. The other constraint was the length of the cockpit. The main car body is 170 inches long so it cannot surpass that length. There also needs to be enough flat space on the body for the solar array. Figure 1 below shows a plot of the length to height ratio versus the drag coefficient.
Figure 1: Figure 10 from Hoerner
The ideal ratio is around 10 but with our height constraint this would make the length too long. The current ratio is 79.12/16.25 or 4.86. In the current design, there are about 4 inches available to be taken off the cockpit's height. To ensure the driver's head is not touching the top of the roll cage inside, only 1.25 inches were taken off. This leaves a cockpit height of 15 inches. To leave enough room for the array a length of 90 inches was determined. This height and length give a ratio of 6 which reduces the drag coefficient of the cockpit from around 0.15 to 0.1, a 50% reduction. The next step in the cockpit design was the maximum width and width in the rear. In Figure 2 below the maximum width is defined as “b” and the width in the rear is defined as “e”. The reading shows there is a benefit for not having the cockpit's rear come to a point shown by 0 on the plot.
Figure 2: Figure 12 from Hoerner
The current cockpit maximum width (20 inches) was kept the same because the driver needs room to sit and steer. The current design also comes to a point which is not the lowest drag coefficient that can be obtained. The plot above shows the ideal ratio is between 0.2 and 0.3. This means that based on the ratio and a b of 20 inches, the rear width is 10 inches. This new design raises the ratio from 0 to 0.2 which gives a slight decrease in drag coefficient. A top and side view of the cockpit can be found below.
Figure 3: Side view of new cockpit
Figure 4: Top view of new cockpit
Figure 5: Top view of old cockpit (orange)
Figure 6: Side view of cockpit (orange)
Fairing Design. The fairing design change is the most noticeable of the 3 changes. This change not only reduces drag but also reduces weight. The current fairing design would be best described as a pontoon. There are 2 on either side of the car that house the wheels. They are shown below.
Figure 7: Old pontoon design
By researching other solar cars, we found that many of them use more than 2 fairings. We decided on a design that would use one fairing per wheel and they would each be a symmetric airfoil shape. Our calculations and decisions were made with guidance from the book A Solar Car Primer by Erica Forsta Thacher which was provided to us by the MSU Solar Racing Team. Calculations were done in Microsoft Excel where different airfoil shapes were compared. The shapes tested were the NACA 0006, 0009, 0012, 0018, 0025, and 0040. Airfoils that start with “00” means they are symmetric. The last 2 digits are the maximum thickness as a percentage. It is a percentage of the chord length. For example, a NACA 0006 with a chord length of 100 inches has a 6-inch maximum thickness. Some dimensions that needed to stay constant were the span (b), the thickness (t), and 𝑦𝑚𝑖𝑛 . The first step to finding the drag coefficient and dimensions for the fairings was to do calculations of the fairings in free air. Based on a constant thickness, the chord length (c) could be found for each shape. With a length for each shape the Reynolds number was calculated using the equation below.
Using the Reynolds number and a table in the book, the drag coefficient was estimated. The first table was used for the NACA 0006, 0009, 0012, 0018, and 0025. The plot below was used for the NACA 0040 but could also be used for the others.
Figure 8: Reynolds number and drag coefficient table from A Solar Car Primer Figure 9: Reynolds number v drag coefficient plot from Hoerner
Although we now have a drag coefficient for each shape, it is not fully accurate. The calculations need to be corrected for various interferences such as ground effect, being connected to a wall, being parallel with another fairing, and having one behind/in front of another. Ground effect is assumed to not have any effect on the drag for the fairing so it can be ignored. The first interference that will be considered is the wall interference. The current drag coefficient is based off free air, but our airfoil is connected to the bottom of the main body on one side. The equation below is from Hoerner and uses the thickness and chord lengths to find the correction drag coefficient. 𝑡 0.0003 Δ𝑐𝐷𝑡 = 0.75 ⋅ ( ) − 𝑐 𝑡 2 (𝑐) Δ𝑐𝐷𝑡 = 0.75 ⋅ (
Now that we have the wall correction it can be added to the free air drag coefficient. The next correction is from 2 airfoils in parallel. The book provides an equation to find this correction. The equation uses the 𝑦𝑚𝑖𝑛 and thickness to find the correction. As mentioned before the 𝑦𝑚𝑖𝑛 and thickness are kept constant. The 𝑦𝑚𝑖𝑛 is the distance between 2 parallel airfoils. This is further explained in the figure below.
Figure 10: 𝑦𝑚𝑖𝑛 example from A Solar Car Primer
This correction can now be added to the new drag coefficient we obtained from the wall interference correction. The next correction is from 2 airfoils in series. This correction is fairly easy from the figure below.
Figure 11: Drag coefficient plot for two airfoils in line from A Solar Car Primer
Using estimations from the figure above, the total drag cancels each other out and can be ignored. This plot is still useful to ensure that the airfoils are placed properly. The x distance above could not be changed but it could still be confirmed. Our x value is 105 inches. This gives a ratio of 1.68. Ideally the number would be higher but due to constraints this is the best value. All these calculations and relationships bring us to the final decision. The NACA 0040 gives us the best drag coefficient for our system. The final design of the fairings on the car can be viewed below. 25 in
Figure 12: Bottom view of new fairing design
Figure 13: Side view of new fairings
The total drag force of the fairings was calculated with the new drag coefficient using the equation below. A sample calculation for the NACA 0040 is included.
Compared to the initial design of the pontoons, the new airfoil design has a lower drag coefficient and reduces the vehicle's weight. The precious drag coefficient was estimated from Hoerner to be around 0.8 from the given length to diameter ratio. The figure used can be seen below. It is important to note that this value is a free air drag coefficient. With a corrected drag coefficient of 0.395, the new design is over 50% better than the original.
Figure 14: Drag coefficient plot from Hoerner
Main Body design. The main body of the car plays a crucial role in the vehicle’s performance. In addition to housing the driver, it must be a smooth, low-drag surface for airflow that supports the solar array. The weight of the current body is around 150lbs. A design constraint provided by our industrial advisor was not to exceed this value in lift generated by the body. The car is assumed to operate at a zero-degree angle of attack as the endurance race occurs over mostly flat terrain. The reason we want the body to generate lift is improved handling and stability as well as energy savings leading to enhanced range for the car. The body generating lift effectively counteracts a portion of the vehicles weight. The lift force acts in the upward direction, opposite the downward gravitational force on the car. The result is that the net weight pressing down on the wheels and suspension is reduced. This reduction in net weight at operating speeds leads to better handling and improved stability due to more even weight distribution. The lift produced also effectively reduces the normal force acting on the car which in turn reduces the kinematic friction force requiring less energy to overcome it. Too much lift is undesirable as this would compromise traction and stability. A delicate balance between lift and traction must be achieved. Several airfoils and their zero-degree angle of attack characteristics were considered. It is important to note that the evaluated airfoils are not the only suitable geometries, they were chosen for their extensive preexisting testing data simple geometry for manufacturing. It would be unrealistic to evaluate all suitable candidates in our timeframe. The NACA 4412, 4415, 4418, 6409 and 2412 were our primary candidates for achieving a realistic lift coefficient at zerodegree angle of attack, while maintaining ease of manufacturing and integration with other body parts. The length of the car is 170 inches. Its operating speed is 45 mph. The kinematic viscosity of air is taken to be 0.0242 in^2/s at standard atmospheric conditions. using equation (1), the Reynolds number is: 𝑅𝑒 =
Xfoil was used to obtain the coefficient of lift 𝐶𝐿 , moment coefficient 𝐶𝑀 , coefficient of drag 𝐶𝐷 , and lift/drag ratio L/D at zero-degree angle of attack α for all candidate airfoils at the calculated Reynolds number above as illustrated in figures 15-19. Note, 𝑁𝑐𝑟 is the critical amplification factor, this is a parameter used in airfoil analysis to determine the transition point where laminar flow turns turbulent. The typical range is 7 to 14. Higher values assume more stable laminar flow and delayed transition to turbulent flow, which can result in lower drag results. Lower values conversely assume earlier transition which leads to higher drag predictions. A value of 9 was chosen for 𝑁𝑐𝑟 . The value is a reasonable choice for the expected moderate free stream turbulence, smooth surface, and Reynolds number on the order of 106 . The value 9 strikes a balance between assuming laminar flow and taking other factors into consideration, it is also the default value used in Xfoil consistent with industry practice for related applications.
Figure 15: NACA 4412 airfoil data
Figure 16: NACA 4415 airfoil data
Figure 17: NACA 4418 airfoil data
Figure 18: NACA 2412 airfoil data
Figure 19: NACA 6409 airfoil data
The primary design constraint for the body is the height of the driver. The team typically utilizes drivers around 5ft (60 inches). The next constraint is ensuring the driver has enough clearance to fit in the car. 2.75 inches is allocated above the driver’s head (per the cockpit design) and 5 inches between the base of the seat and the bottom of the car (this is the average in industry). This results in a total required clearance of 7.75 inches. The driver will sit in the car at an inclined angle of 30 degrees from the vertical position, similar to seats used in Formula one cars. The leading edge of the cockpit is 50 inches from the leading edge of the body, an ideal position obtained from the current solar team’s design. The maximum height of the cockpit is 45 inches from the leading edge of the cockpit. Therefore, the maximum height of the cockpit is 95 inches from the leading edge of the body. A thickness distribution calculator (shown in figure 20) was used to obtain the thickness of the body 95 inches away from the leading edge, as this is where the maximum height of the cockpit is located. That value (upper surface + |lower surface| at x = 95 in figure 20) was then added to the maximum height of the cockpit to determine the total vertical space available for the driver. This process was performed for all candidate airfoils. The results are shown in table 1. Note that the thickness includes the maximum height of the cockpit (15 inches).
Figure 20: Thickness distribution calculator for NACA 4412
Table 1: Thickness 95 inches from body leading edge
A 5ft woman was measured from the top of her head to the base of her spine. This length was 26 inches. Using Pythagoras’ theorem, at a 30-degree inclination from the vertical upright position, she will occupy 22.52 inches of vertical space (seating position shown in figure 21). From this result, the NACA 6409 airfoil was eliminated.
Figure 21: Driver seating position
The next point of consideration is lift and drag coefficient. The lift generated by all the candidate airfoils has been determined to be insufficient to cause traction issues, so we optimize for the highest coefficient of lift while minimizing drag. From the Xfoil data, the NACA 2412 has the lowest coefficient of lift, so it is eliminated. The dominant parameter is the drag coefficient, so we want to select the airfoil with the lowest value from the remaining airfoils. This leaves us with NACA 4412. It has sufficient space for the driver and satisfies the rest of our design criteria. It also has a moderate camber for ease of manufacturing and integration to other components of the car, resulting in minimal interference drag. From the lift equation and calculation at (11), the 4412 airfoil with chord length 170 inches produces approximately 19.206 lbf of lift while travelling at 45mph, well below our 150lbf limit.
Conclusions and Recommendations. The primary goal of this project was to design an improved solar car body for the MSU Solar Racing Team that enhances aerodynamic performance while maintaining ease of manufacturing. Through extensive research, benchmarking, and analysis, our team developed a novel design that significantly reduces drag and weight in comparison to the current design. Key improvements include: 1) Cockpit design: By optimizing the length-to-height ratio and the width of the rear, the new cockpit design achieves a 50% reduction in drag coefficient. 2) Fairing design: Moving from a pontoon design to individual symmetric airfoil shaped fairings at each wheel decreases weight and results in a drag coefficient reduction of 50%. 3) Main body design: The NACA 4412 airfoil was selected for the main body due to its superior lift-to-drag ratio, sufficient driver clearance and ease of manufacturing and integration with other components. The design improvements collectively contribute to increased efficiency as less power is required to travel the same distance. The reduced weight and improved aerodynamics also led to better handling, stability, and overall performance. We strongly recommend implementing these changes in future iterations of the Solar Team’s car. The new designs can be implemented into the current manufacturing process using carbon fiber, thereby minimizing the learning curve and additional resources required. For further validation of the performance gains, we suggest wind tunnel testing on scale models of the new design. From our initial planning, the wind tunnel at Western Michigan University is available for testing a 1/4th scale model without significant error. This will provide valuable data to refine the design and optimize its operating condition encountered in the race.
Appendix B (references). Hoerner, S. F. (1965). Fluid-dynamic drag: Practical information on aerodynamic drag and hydrodynamic resistance. Thacher, E. F. (2010). A Solar Car Primer. Nova Science Publishers.
Appendix C. The CAD file of the car is located at: "T:\courses\ME\481\Sections\001\Teams\Team 23\Models\New Designs\FINAL BODY\DONT EDIT ITS ACTUALLY FINAL.prt"
Figure 23: Front view of body Figure 22: Bottom view of body
Figure 25: Side view of body Figure 24: Isometric view of body
Figure 27: Main body airfoil
Figure 26: Top view of body
Figure 29: Wheel Fairing Figure 28: Cockpit
Table 2: NACA airfoil calculations
Table 3: Corrected NACA airfoil calculations
A solid-propellant rocket for a STEM competition in South Africa

I persuaded my school's faculty to let me develop a full-fledged solid-propellant rocket for an international STEM competition in South Africa; I was captain. In Botswana, however, we don't have any hobbyist shops for this, so I made everything, from the fuel to the fuselage, from scratch. The project has given me an extensive insight into many aspects of Industrial Design and Engineering.
As for the competition? Our school came first, and I won first place for individuals. This experience was some of the most fun I've ever had. The launch catastrophes, the shattered windows, the almost blown off fingers, the melted dust bins, the raging teachers, the late nights, and the overwhelming stress. I loved it so much that I did it again the year after but with a different project. The lack of resources required for my ventures provided challenging and realistic problems to solve. Instead of buying everything, I had to seek raw materials, machinery, contractors and budget my expenses much like in industry. I learned a lot of vital skills in the process that have no doubt proven useful in university and I'm sure will beyond. Particularly patience, clear and effective communication, resilience, teamwork, problem solving and negotiation techniques such as rapport building and active listening.
Solar module process engineering at First Solar
At First Solar, I was involved in lots of different projects. On the development engineering finishing team, I validated and optimized a novel ultrasonic welding process for solar modules. I utilized JMP statistical analysis software to analyze the test data, and the results drove the process changes. I also helped assemble and test new tandem solar modules that combine monocrystalline and thin film technology for higher conversion efficiency.
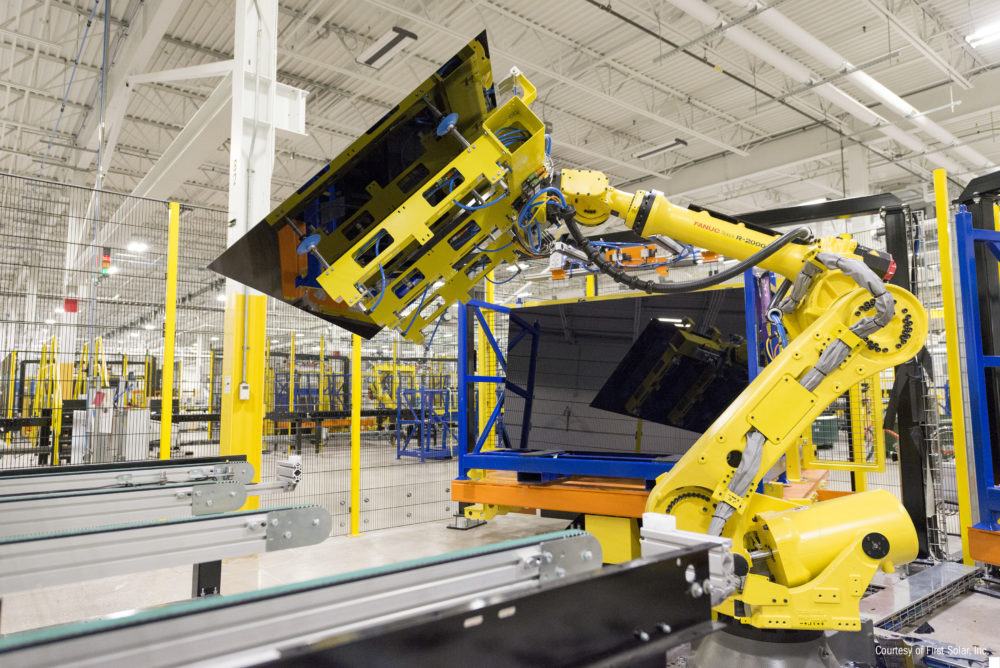
NSBE-MSU: chapter website, social media and sponsorships

I led our social media rebrand from a fragmented set of names to one handle. I redesigned the chapter website (nsbemsu.org) and kept it current, and I solicited sponsorships from companies including SpaceX to support the chapter.
Boron-doped diamond and carbon fiber electrodes
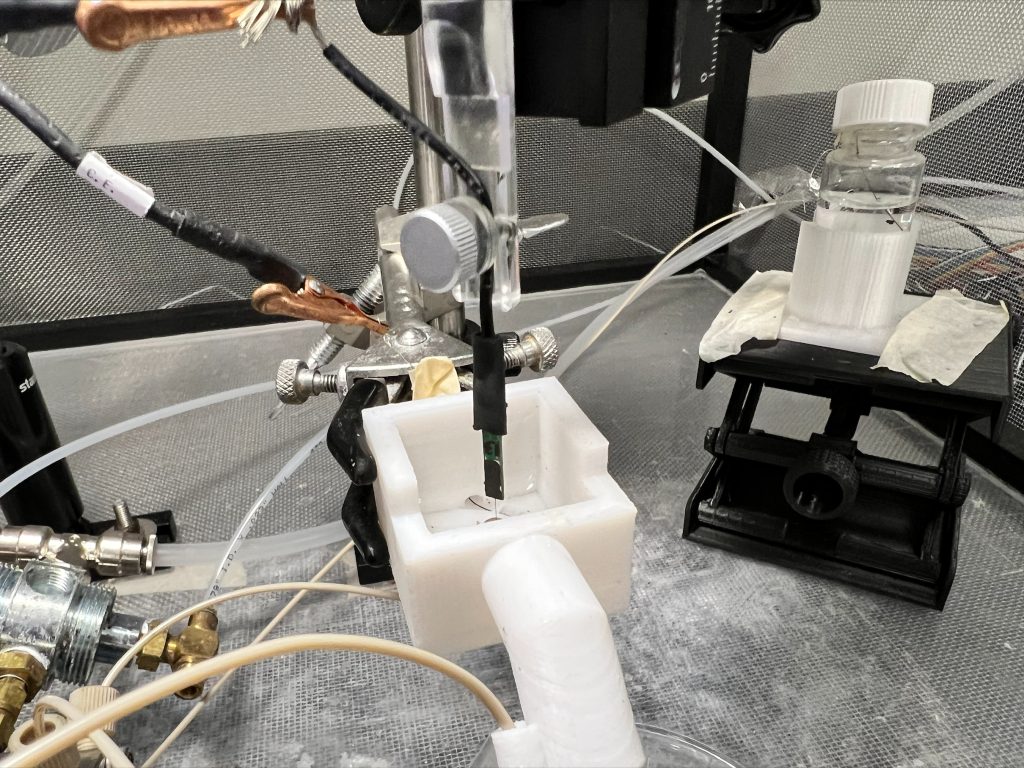
This is the flow cell setup that we used to test our electrodes. It serves to simulate conditions of the brain. We pumped a solution that mimics brain conditions into the white 3D printed part and test electrode sensitivity to various neurotransmitters like dopamine and serotonin.
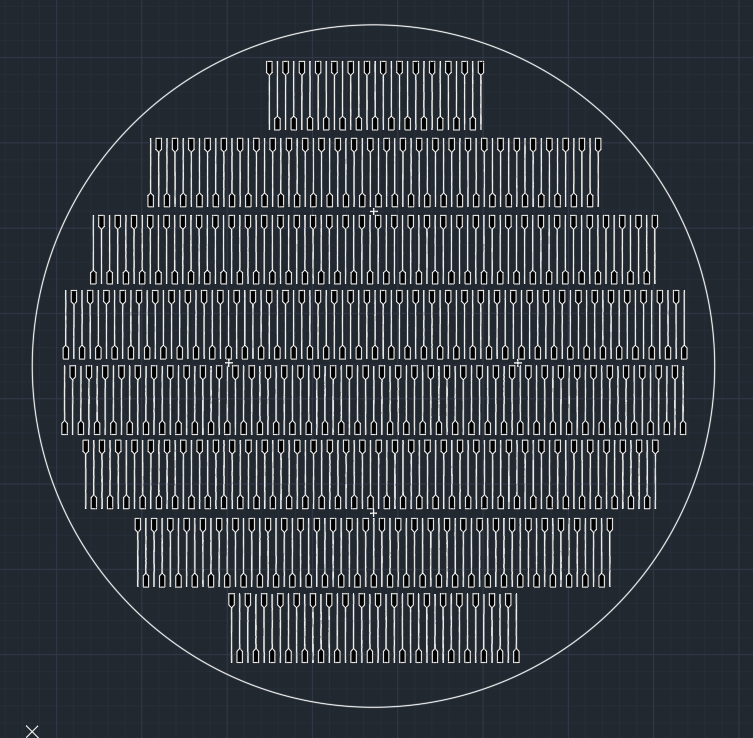
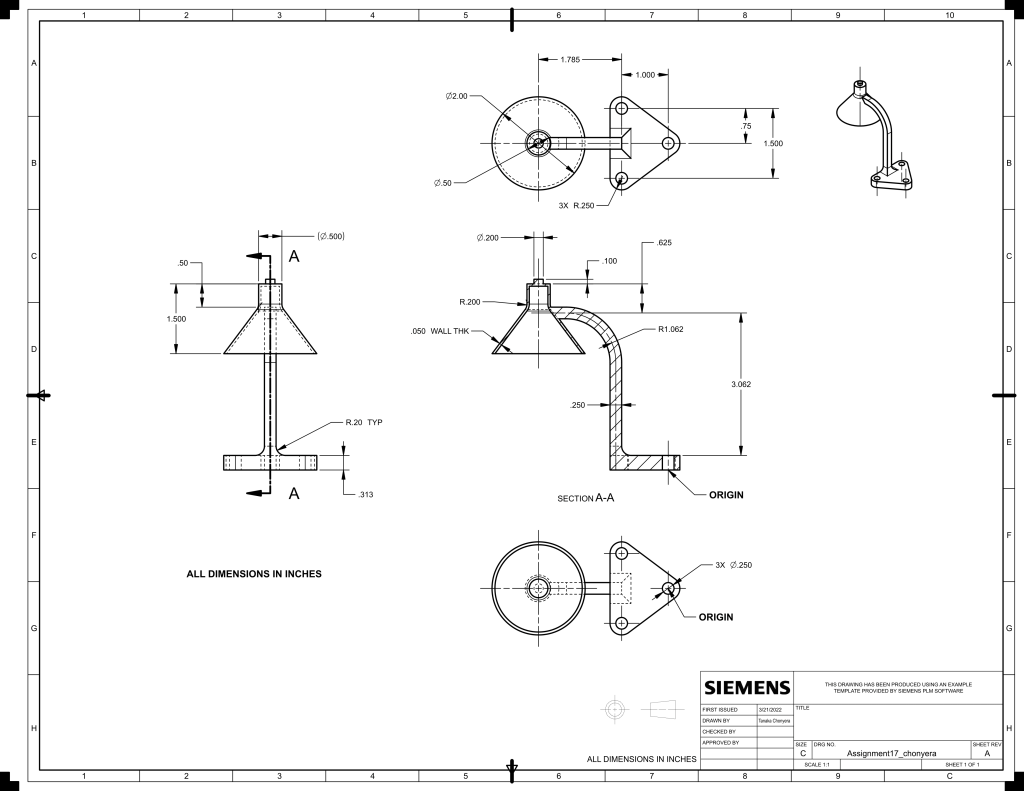
This is an AutoCAD sketch I made that we use as a template to grow diamond electrode needles at Fraunhofer USA:
We tested for dopamine by cycling a voltage applied to the electrode from -0.3V to +1.4V and measuring current response. At around -0.1V, the dopamine is reduced resulting in the negative peak shown. At around +0.7V, the dopamine is oxidized resulting in the positive oxidation peak. One of my carbon fiber electrodes successfully measured dopamine in vivo in a rat's brain, aiding in Parkinson's research at the Institute for Quantitative Health Science and Engineering at MSU.
These are the boron doped diamond electrode needles I assisted in fabricating. We were investigating them as a replacement to industry standard carbon fiber electrodes as they last longer. Carbon fibers etch away as they are used and eventually need to be replaced. Boron doped diamond is more stable. Dopamine in the brain is hard to detect because it has such low concentration (it's of the order nanomolar per Liter) so sensitivity is important. We ran experiments to increase the sensitivity while maintaining its durability. I ran long term experiments evaluating different coatings utilizing fast scan cyclic voltammetry and A.C. Impedance spectroscopy, and tested their effects on neurotransmitter sensitivity. I also contributed to a research paper with this data.
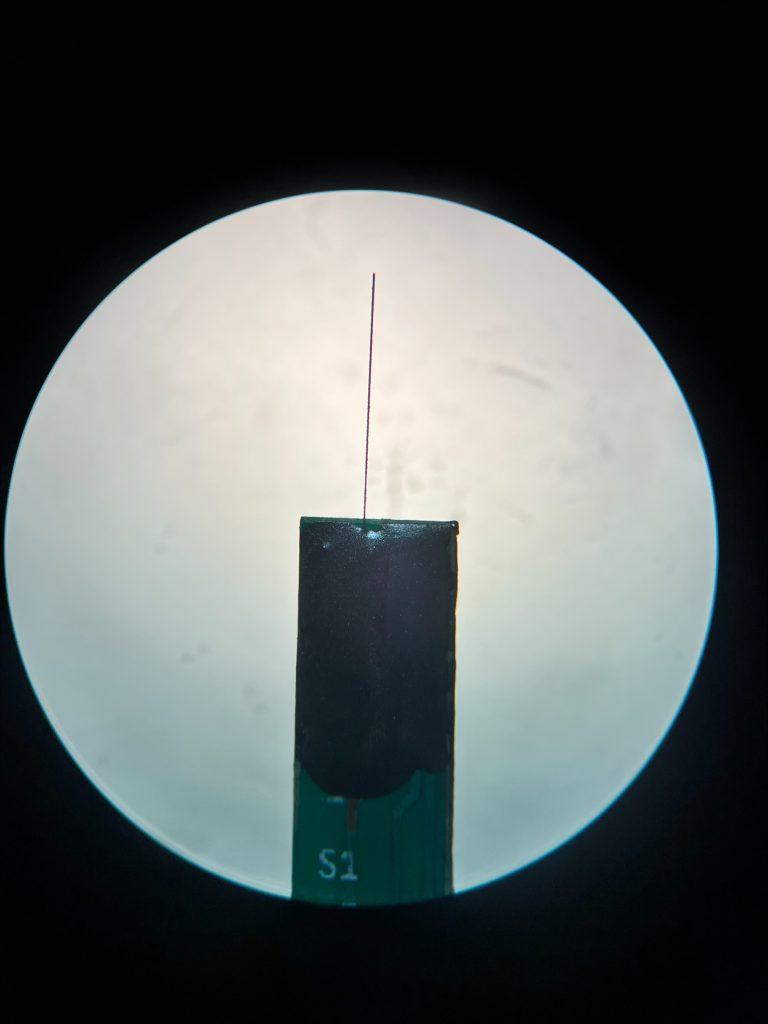
Published in Biosensors (experiment contributor)
Published research in MDPI Biosensors:
High voltage divider for laser spectroscopy at FRIB
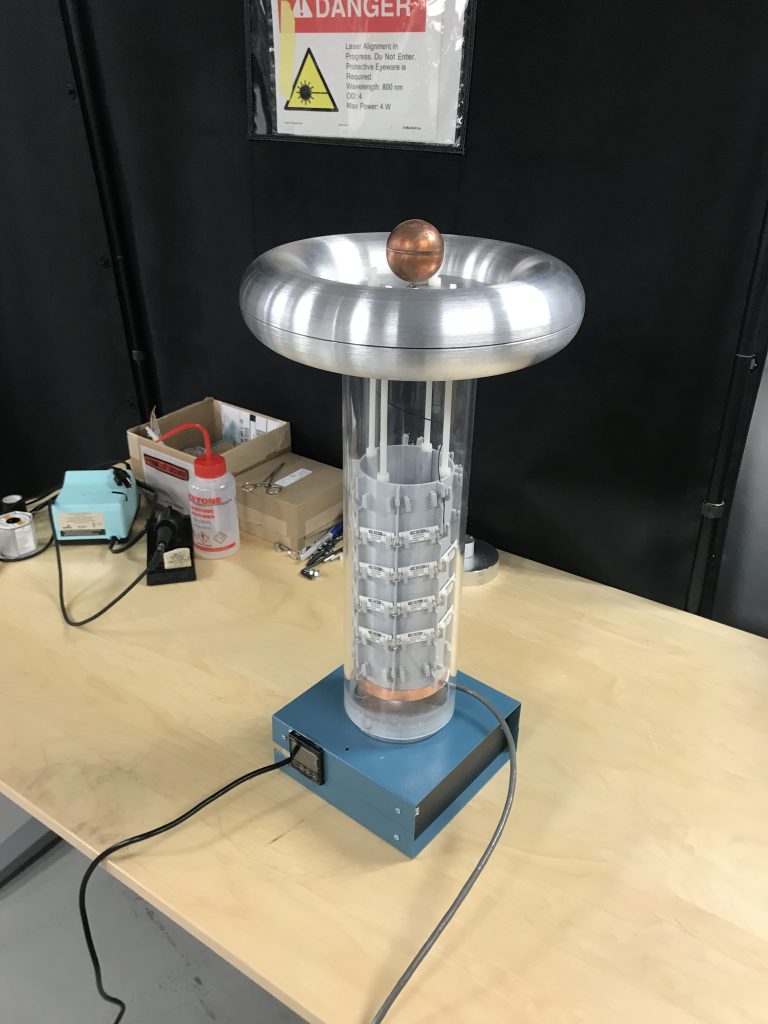
As part of the Wielenga Research Scholars program at Michigan State University (with a $5,000 grant awarded), I joined Dr. Kei Minamisono's team at the BEam COoling and Laser Spectroscopy (BECOLA) facility at the Facility For Rare Isotope Beams (FRIB).
Accurate knowledge (at a few ppm level) of the beam energy, i.e., the high voltage potential applied to the beam, is crucial to deduce very small nuclear structure information.
I designed (in Siemens NX) and manufactured a High Voltage Divider for use in a Collinear Laser Spectroscopy Experiment identifying the laser spectrum of radioactive nuclei.
I analyzed and processed output data from the high voltage divider using Python to determine divider ratio and compare performance with a stock high voltage divider from the National Metrology Institute of Germany.
Video: building the high voltage divider

UURAF 2022 poster: accurate high voltage measurement for laser spectroscopy
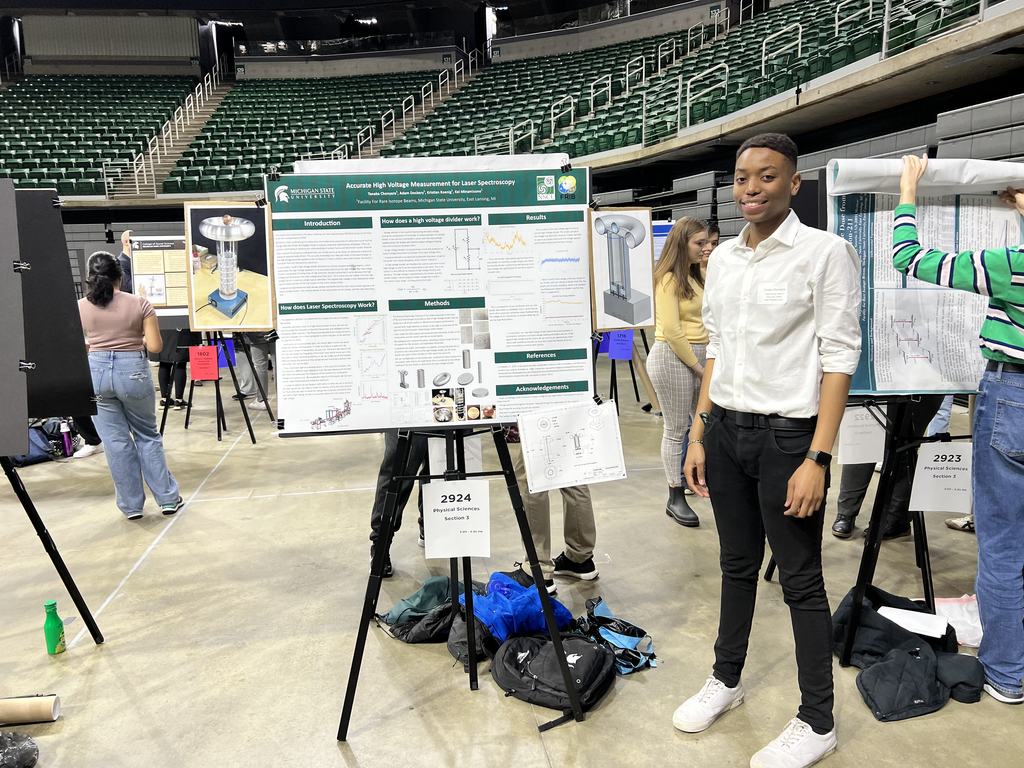 Open the UURAF poster (PDF) ↗Download PDF ↧
Read the text
Accurate High Voltage Measurement for Laser Spectroscopy. Tanaka Chonyera, Adam Dockery, Kristian Koenig, Kei Minamisono. Facility For Rare Isotope Beams, Michigan State University, East Lansing, MI.
Introduction. This project was performed at the BEam COoling and LAser Spectroscopy (BECOLA) facility at the Facility for Rare Isotope Beams (FRIB). BECOLA's main undertaking is to determine the fundamental properties of radioactive nuclei such as charge radii (the proton distribution inside a nucleus) using laser spectroscopy techniques. This is essential in attempting to advance our understanding of nuclear forces and benchmark nuclear theories. Laser resonant fluorescence measurements are carried out on an ion beam of radioactive nuclei at an energy of approximately 30 keV. The accurate knowledge (at a few ppm level) of the beam energy, i.e. the high voltage potential applied to the ion beam, is critical to deduce very small nuclear structure information from the fluorescence spectrum. In this project, I built a high voltage divider (because our old one stopped working properly), which scales down the high voltage applied to it, to accurately determine the high voltage. The high voltage divider is comprised of a long chain of high precision resistors connected in series between the high voltage and the ground. The small voltage drop (less than ~10 V) across the last resistor from the high voltage (30 kV) is read out using a typical voltmeter. The applied high voltage is then deduced by knowing the resistance ratio of the last resistor to the entire resistor chain. I designed and assembled the high voltage divider and performed the ratio measurement against a reference voltage divider. I will present details of the construction of this divider, and the ratio determination.
How does a high voltage divider work? Voltage division is the result of distributing the input voltage among the components of the divider. A simple example of a voltage divider is two resistors connected in series, with the input voltage applied across the resistor pair and the output voltage emerging from the connection between them. A high voltage divider is a passive linear circuit that produces an output voltage (Vout) that is a fraction of its input voltage (Vin). A passive element is an electrical component that does not generate power, but instead dissipates, stores, and/or releases it. A high voltage divider can therefore be used to scale down a very high voltage so that it can be measured by a volt meter. This is because it is very difficult to measure a high voltage directly with accuracy. The high voltage is applied across the divider, and the divider output, which outputs a lower voltage that is within the meter's input range, is measured by the meter.
How does Laser Spectroscopy Work? The objective at BECOLA is to determine the shape and radius of radioactive isotopes. Essentially, we shoot a laser at a high velocity beam of ions, the ions absorb the energy from the laser at discrete frequencies and release it as electromagnetic (EMF) radiation. The frequencies absorbed are measured and a spectrum produced. This is then compared to other isotopes of the element to determine its radius. Lasers produce monochromatic light, this means light of only one wavelength and thereby one frequency. In order to produce a spectrum, we need to scan a range of frequencies, not just one. There are two ways to do this. We can change the frequency of the laser itself, which turns out to be very difficult while maintaining stability, or we can make use of the Doppler Effect and adjust the velocity of the sample we are investigating to achieve the same effect. We use the latter. If you shoot laser light at a moving object, in this case the ion beam, the ions observe a different laser frequency from the laser because of the Doppler Effect (the same way the frequency of the sound of an ambulance changes as it passes you). By varying the velocity of the beam, we can scan a wide range of frequencies and produce a spectrum. In order to determine the Doppler Shift (which is what we use to produce the laser spectrum), we need to know the velocity of the ions very precisely. That is why we need to know the voltage very precisely and hence why we need a High Voltage Divider to accurately determine the value of the high voltage.
Methods. The National Metrology Institute of the Federal Republic of Germany (PTB) was kind enough to provide us with a High Voltage divider that we based ours off of and used as a reference to compare performance. I started with rough sketches to dimension all the parts for the 3D Computer-Aided Design (CAD) models. I then made the CAD models and produced technical drafts of each of the components and the entire assembly. My colleagues and I ordered the parts, including a custom made 3D printed support for the resistors, and assembled the divider. I combined the drafts, information on suppliers, pricing and assembly instructions into a document so the High Voltage divider can be reproduced and used in other facilities at FRIB, which has occurred. We ran multiple tests on the divider and I analyzed the data to determine the divider ratio, that is, the scale factor that is multiplied by the volt reading of the last divider to determine the total voltage applied.
The poster also carries the sketches, CAD renders, assembly photos and the ratio-measurement plots; see the PDF.
Technical drawings of the high voltage divider
Full technical draft of the High Voltage Divider:
Open the technical draft (PDF) ↗Download PDF ↧Read the text
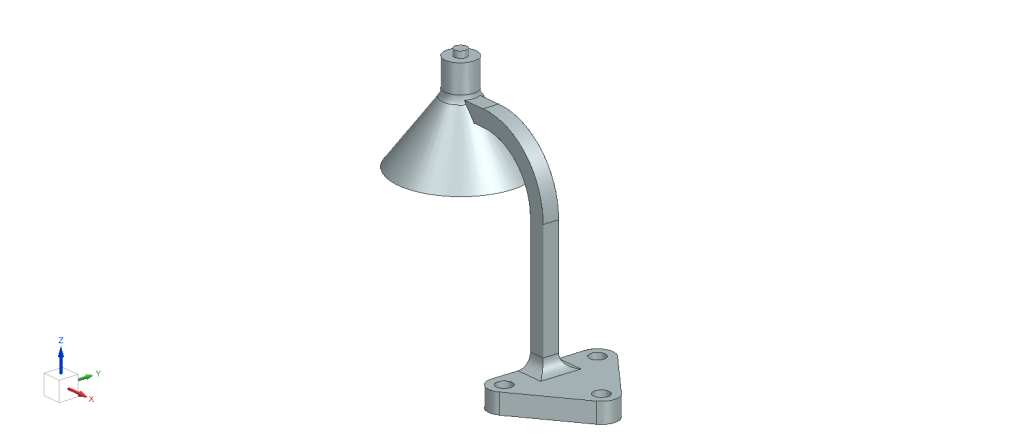
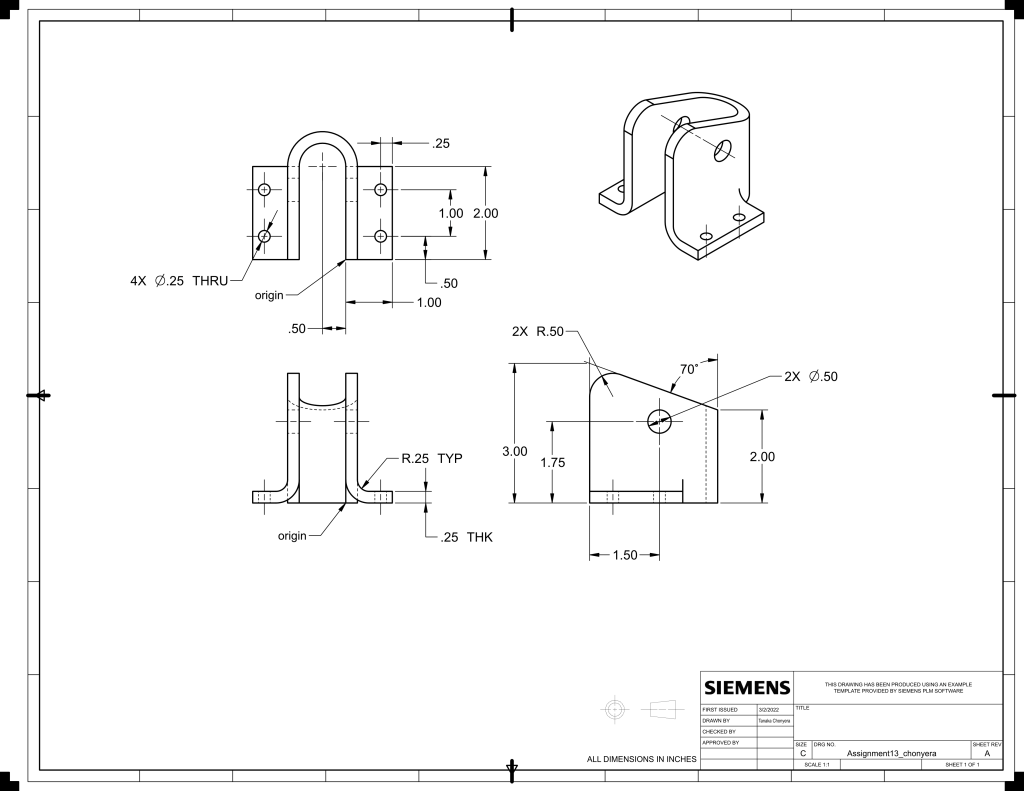
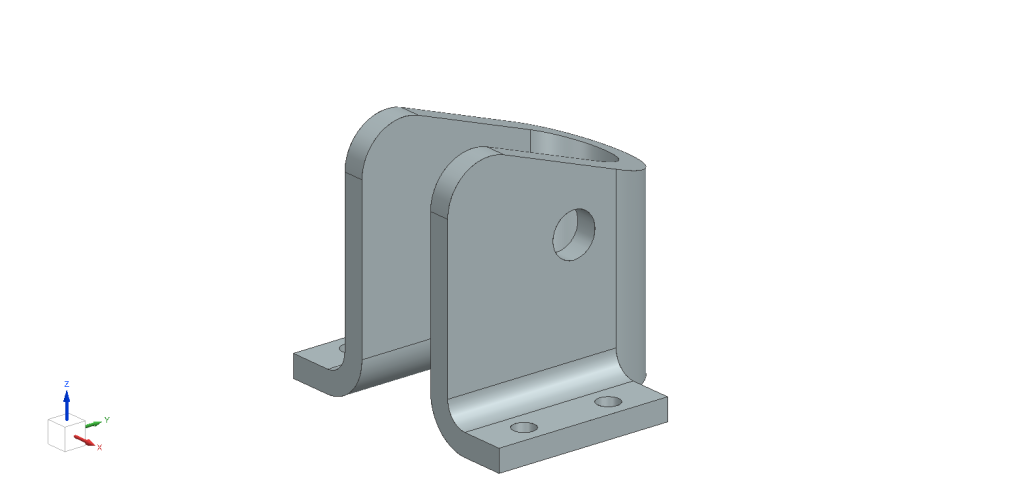
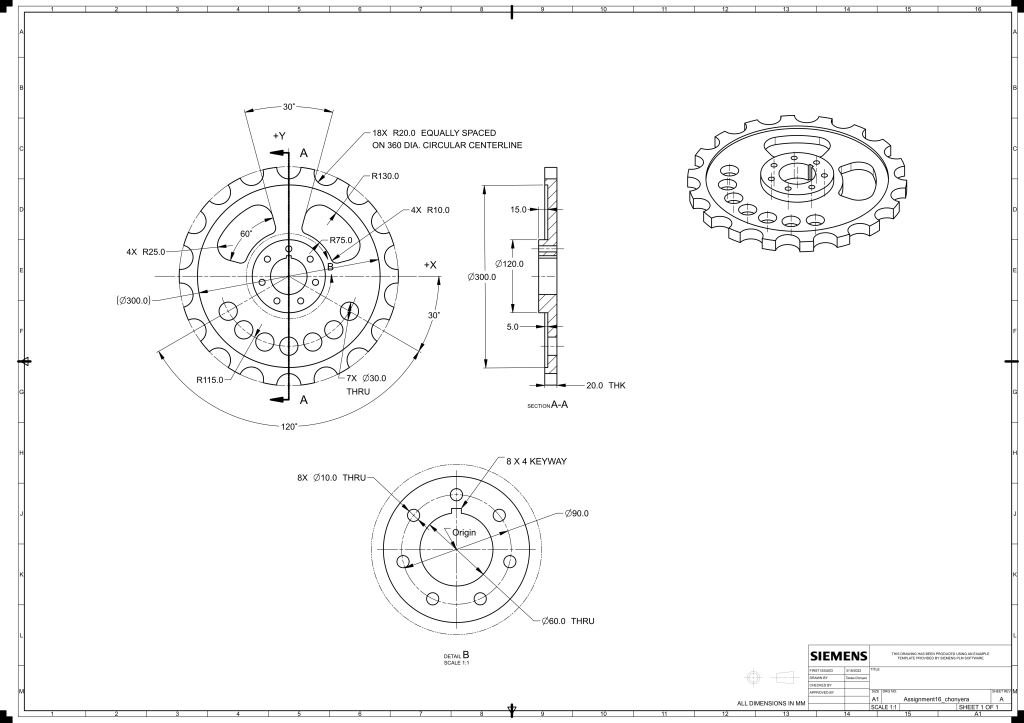
High Voltage Divider technical draft: 10 drawing sheets. Drawn by Tanaka Chonyera, first issued March 11 to 13, 2022, at the Facility for Rare Isotope Beams. All sheets: size C, scale 1:1, sheet 1 of 1, revision A, all dimensions in inches. Each sheet notes that the drawing was produced using an example template provided by Siemens PLM Software.
Sheet 1: High Voltage Divider Assembly. Full assembly with Section A-A. Overall envelope about 21.9 in tall and 12.1 in across, with a 9.0 in square base, 2.0 in diameter column features, and 18.0 in and 10.5 in reference heights. First issued 3/13/2022.
Sheet 2: 3D Printed Part, Sketch based. Material is PLA. Resistor support with 4X 0.250 in through holes, 46X R0.400 in features, 0.450 in inside and outside diameters, 1.500 in, 2.900 in and 3.100 in reference dimensions, 10.000 in length. First issued 3/13/2022.
Sheet 3: HVD Copper Heat Sink. Material is copper, thickness 0.5 in. 8X 0.185 in through, 16X 0.185 in through, 4X 0.138 in through, 2.185 in through bore, R2.000 in, 1.500 in and 1.000 in references. First issued 3/11/2022.
Sheet 4: Toroidal Top Load. Material is aluminum. 18.096 in and 17.996 in outer references, 12.200 in and 12.132 in inner references, 1.500 in section, R1.500 in, 0.185 in through. First issued 3/12/2022.
Sheet 5: Aluminum Base. Material is aluminum. 4.970 in diameter, 5X 0.250 in through, 3.000 in, 1.500 in, 1.000 in and 0.500 in references. First issued 3/12/2022.
Sheet 6: Aluminum Support. Material is aluminum, thread callout 1/4-20 UNC. 21.000 in long, 2.250 in and 1.000 in references. First issued 3/12/2022.
Sheet 7: Copper Ball. Material is copper. 2.000 in diameter, 1.900 in and 1.000 in references. First issued 3/12/2022.
Sheet 8: Acrylic Tube. Material is acrylic, thickness 12 (as noted on the sheet). 12.000 in long, 5.000 in outer, 4.500 in inner, 2.500 in and 2.240 in references. First issued 3/12/2022.
Sheet 9: Threaded Rod. Material is nylon, thread 1/4-20 UNC, 13.000 in long. First issued 3/12/2022.
Sheet 10: Electronics Box. Material is steel. 9.000 in by 9.000 in by 4.000 in. First issued 3/12/2022.
Parabolic solar array
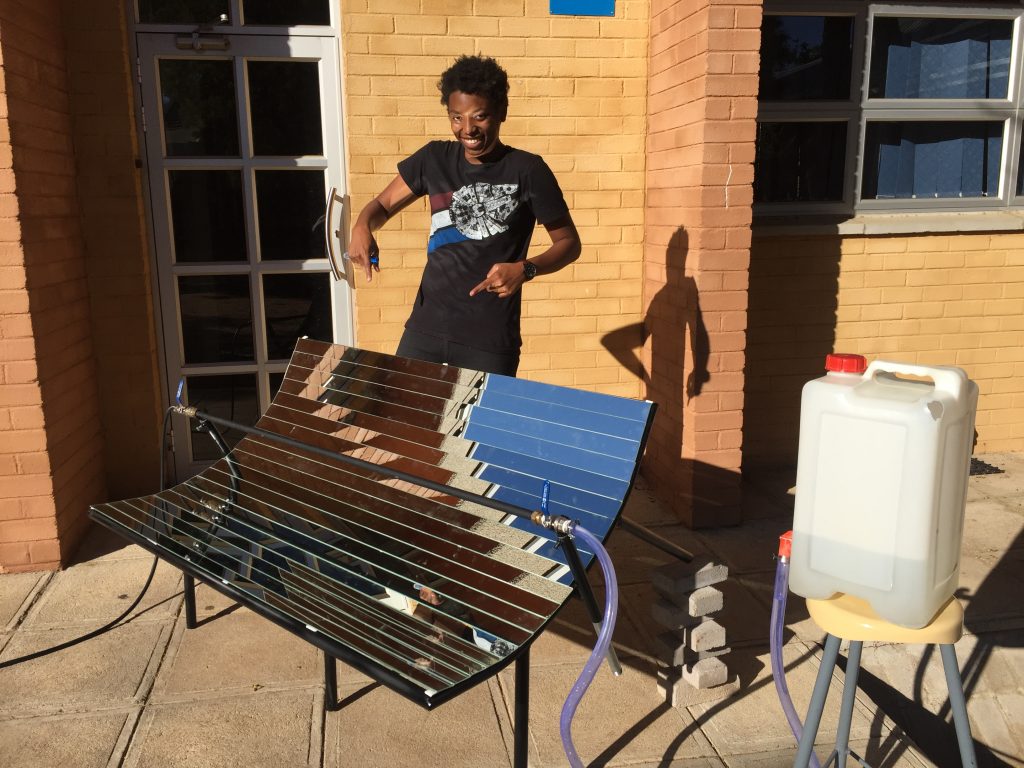
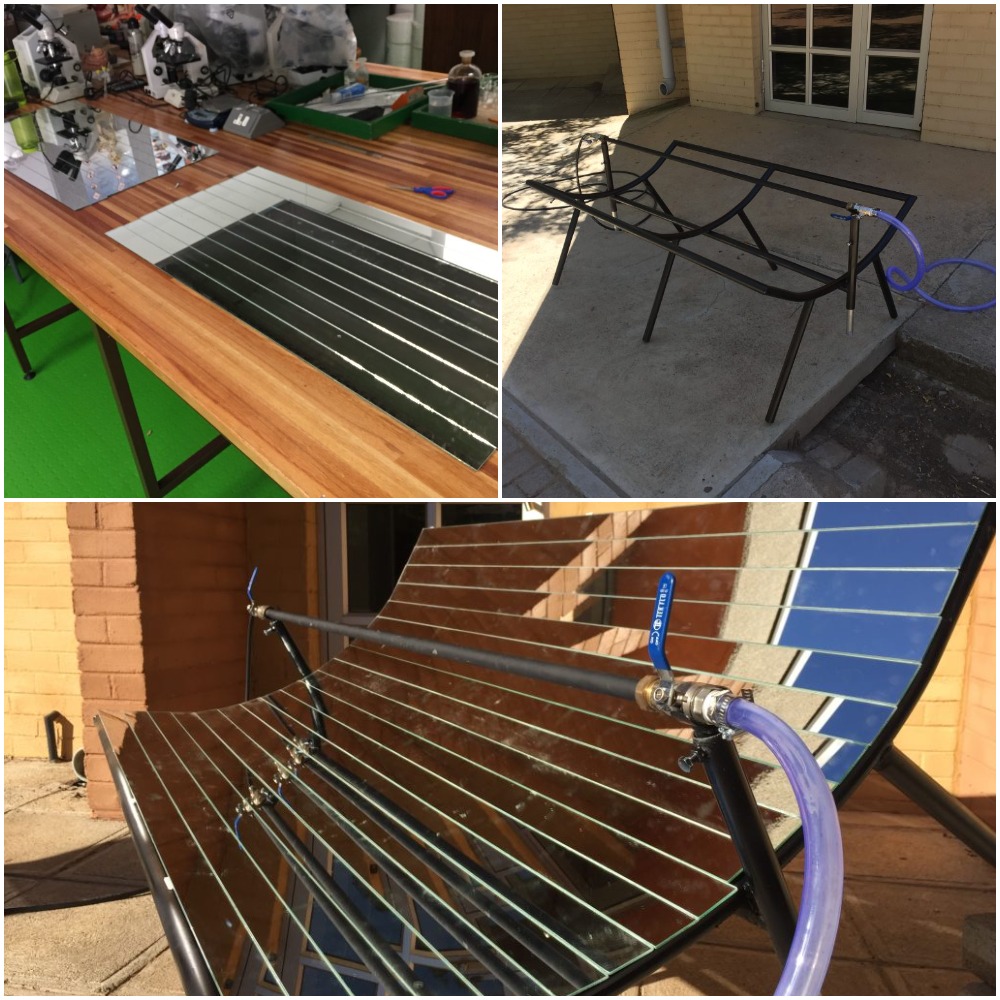
Botswana is the country with perhaps the greatest potential for solar power in the world. Yet, it imports most of its power from South Africa. I designed and built this generator as a proof of concept for affordable renewable energy with rural farmers as the target market.
The mirrors reflect sunlight onto a matte black copper pipe that is filled with either heating fluid or water. If water is used, it is fed into the pipe, closed off and heated until high pressure steam is produced. This is then released and used to turn a turbine and generate electricity.
If heating fluid is used, it can be cycled in a closed loop system and used as a heater.


Programming coursework and projects
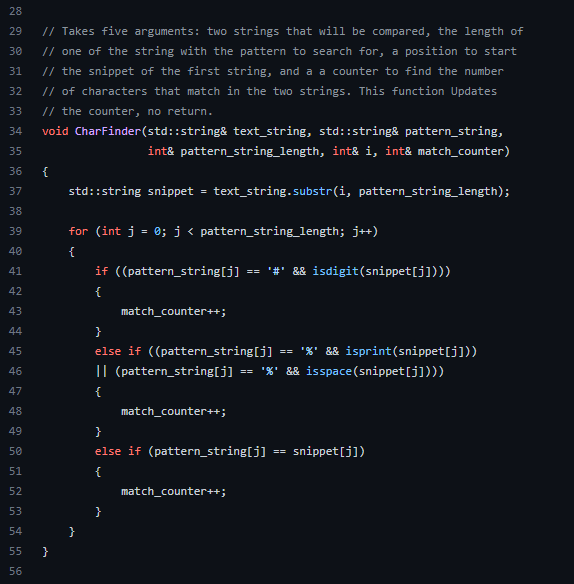
The bulk of my experience comes from college coursework. I've taken classes that covered all basic and many advanced programming concepts such as recursion, algorithms and data structures and object-oriented programming in both C++ and Python. I have a good understanding of computer architecture and how written code is translated into machine language, having used low-level languages like C, C++ and theoretically, assembly.
My college classes are heavily project based. Using C++, we had many projects that required use of concepts learned in class like static and dynamic memory allocation and user defined classes to make a rudimentary cryptocurrency exchange and bank account. Projects in Python included utilizing file processing techniques to make a Pokemon game and extract data from csv files and display them in easily interpretable graphs. I have learned and understand concepts including: space and time complexity (Big O notation), finite state automatons, number theory, proofs and propositional and predicate logic.
Formula SAE
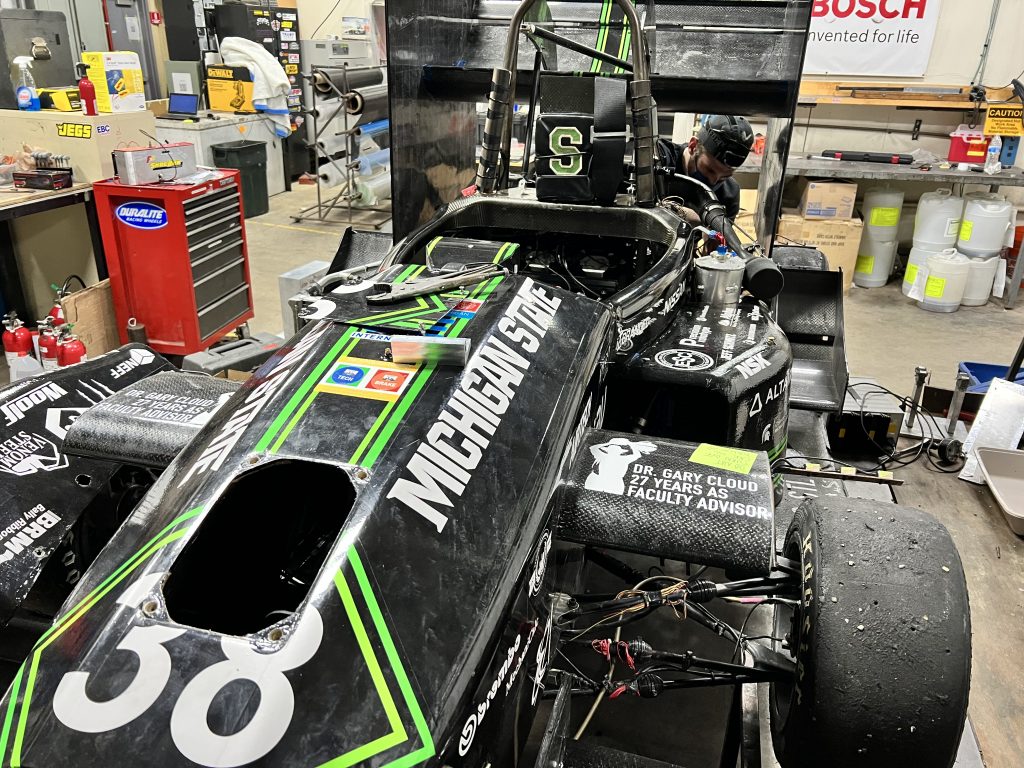
As part of Michigan State University's Formula Racing team, I have machined components for radiator mounts and suspension systems using a manual mill for our new monocoque design.
I researched air filter alternatives for improvement in air-to-fuel ratio, power delivery and combustion efficiency. I also researched alternative front wing designs to prevent failure caused by excessive aerodynamic load.